
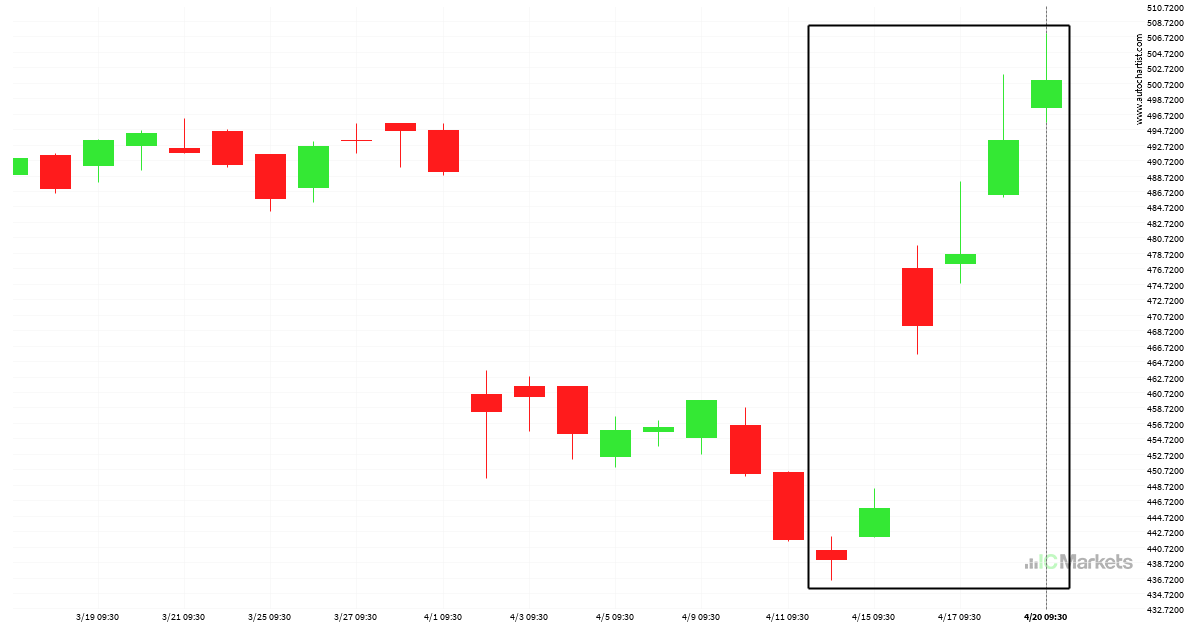
Unitedhealth Group Inc. fue hacia arriba
Unitedhealth Group Inc. ha subido un 14,14% desde 438.98 hasta 501.055 en los últimos 9 días.
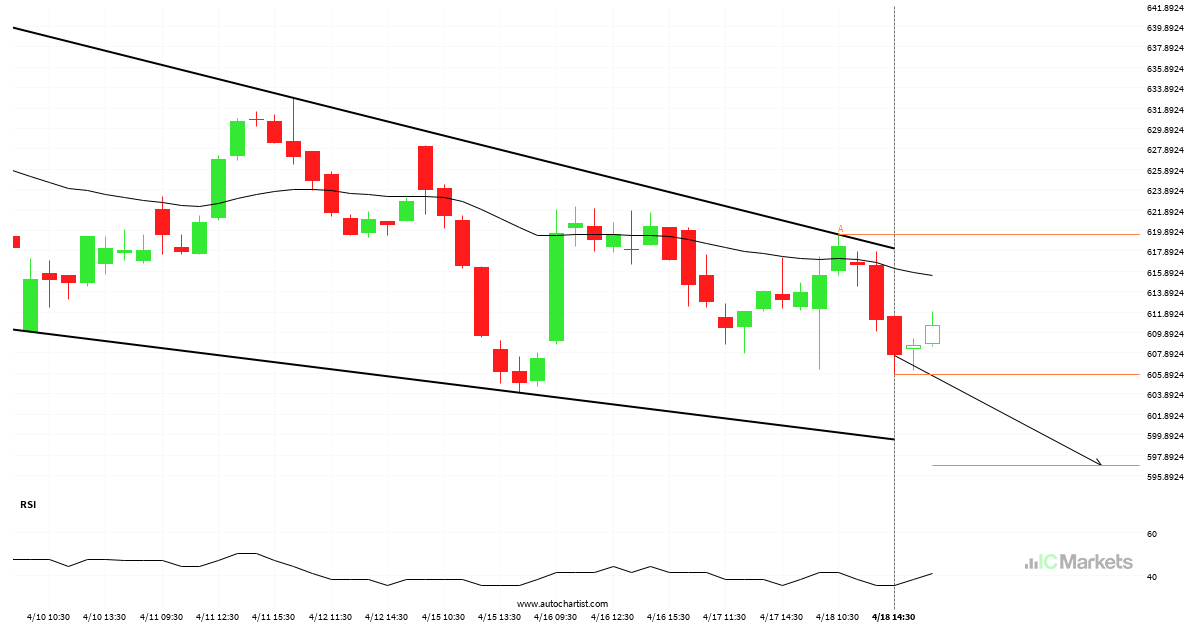
El Netflix Inc. se aproxima a el soporte de un Cuña descendente
El Netflix Inc. se dirige a la línea de soporte de un Cuña descendente. Si este movimiento se mantiene, el precio de Netflix Inc. podría probar el nivel de 596.9017 en las próximas 12 horas. Ya ha probado esta línea en numerosas ocasiones, por lo que este movimiento podría durar poco y terminar recuperándose, igual […]
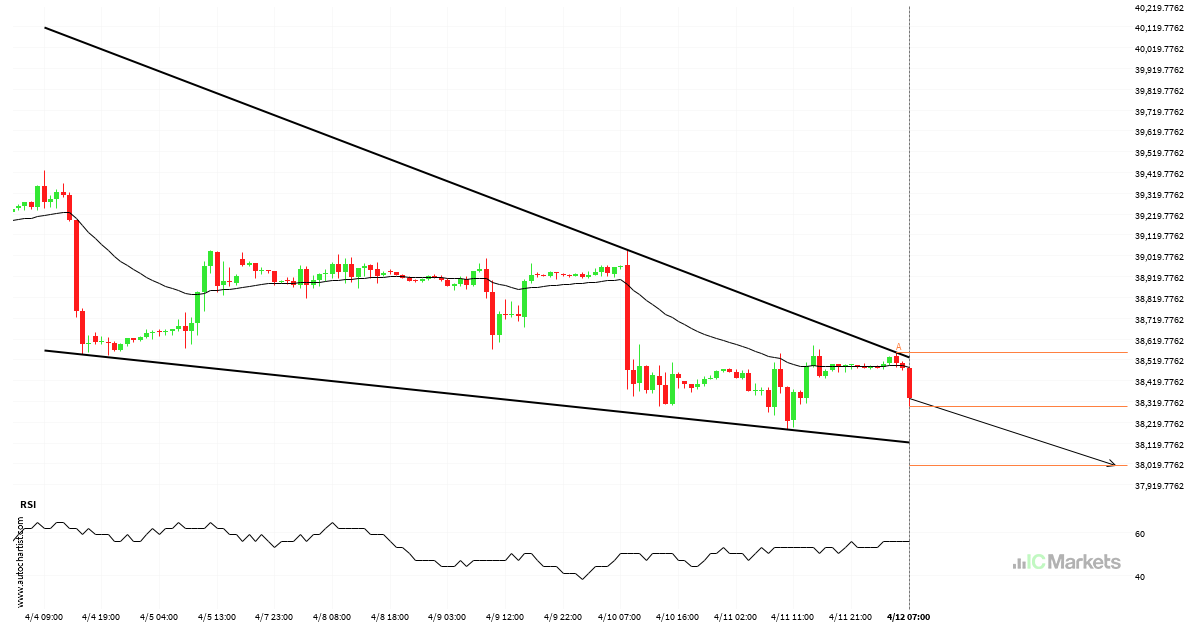
El US Wall Street 30 Index se aproxima a el soporte de un Canal bajista
Se identificó un patrón de Canal bajista en US Wall Street 30 Index en 37638.93, lo que generó la expectativa de que podría moverse a la línea de soporte en 36975.4100. Puede atravesar esa línea y continuar la tendencia bajista o puede girarse desde esa línea.
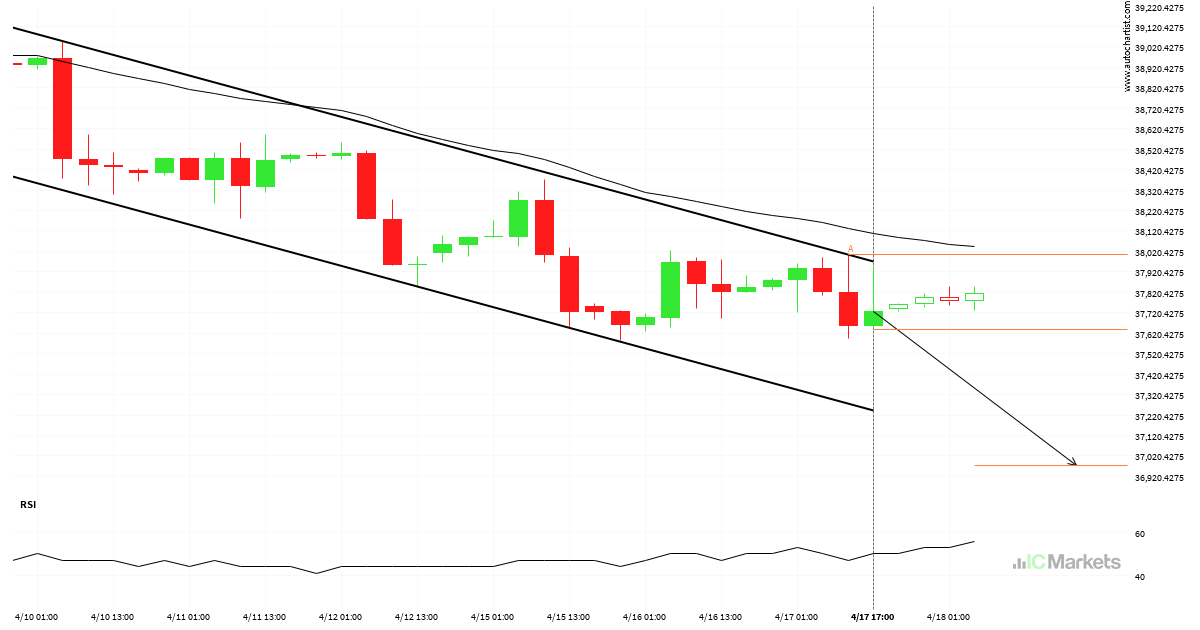
Inminente recuperación o irrupción del US Wall Street 30 Index
Se detectó un patrón de Cuña descendente emergente en US Wall Street 30 Index en el gráfico de 1 Hora. Hay un posible movimiento hacia 38014.0519 en las próximas velas. Una vez que alcance el nivel de resistencia, puede continuar su movimiento bajista o retroceder a los niveles de precios actuales.

ALPHABET INC CLASS C – Patrón de gráfico Continuation – Cuña ascendente
Se identificó un patrón de Cuña ascendente en ALPHABET INC CLASS C en 156.43, lo que generó la expectativa de que podría moverse a la línea de resistencia en 159.9080. Puede atravesar esa línea y continuar la tendencia alcista o puede girarse desde esa línea.
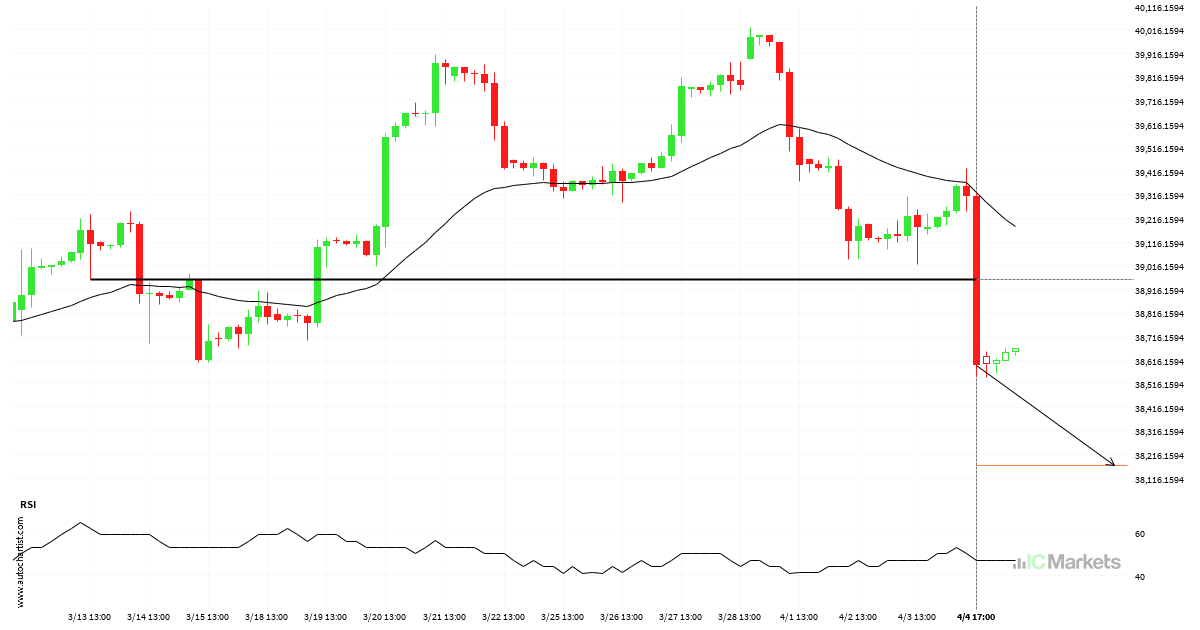
US Wall Street 30 Index: línea de soporte rota a las 2024-04-04T19:00:00.000Z
El US Wall Street 30 Index atravesó la línea de soporte. Como ya lo hemos visto retroceder desde esta posición en el pasado, deberíamos esperar la confirmación de la ruptura antes de operar. Ha llegado a esta línea en numerosas ocasiones en los últimos 23 días, lo cual sugiere un posible nivel objetivo alrededor de […]
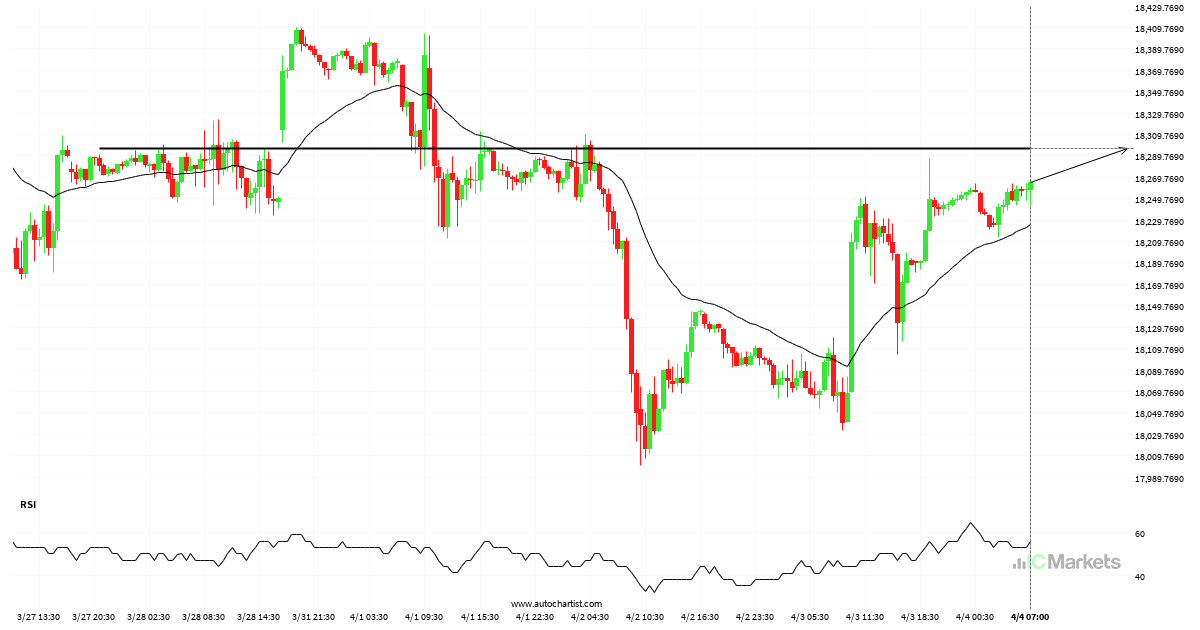
¿Deberíamos esperar una irrupción o una recuperación del US Tech 100 Index?
El US Tech 100 Index avanza hacia 18296.5801 y podría alcanzar este punto en un plazo de 2 días. Ha probado esta línea previamente en numerosas ocasiones y esta vez no tiene porqué ser diferente, terminando con una recuperación en lugar de en una rotura. Si la rotura no ocurre, podríamos observar un retroceso de […]
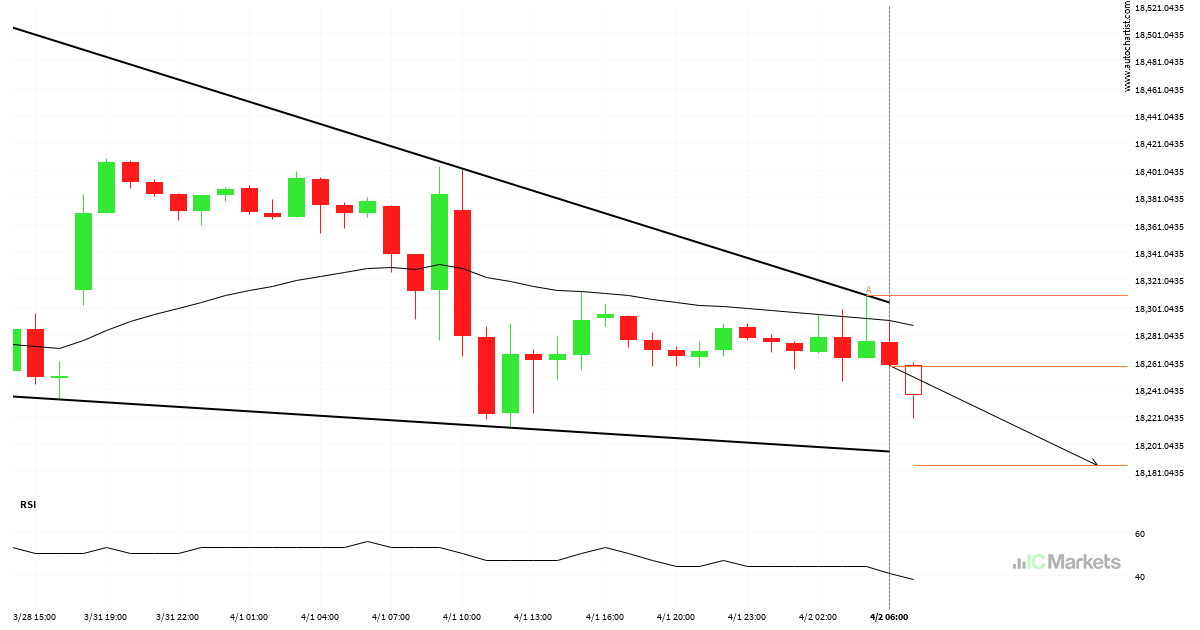
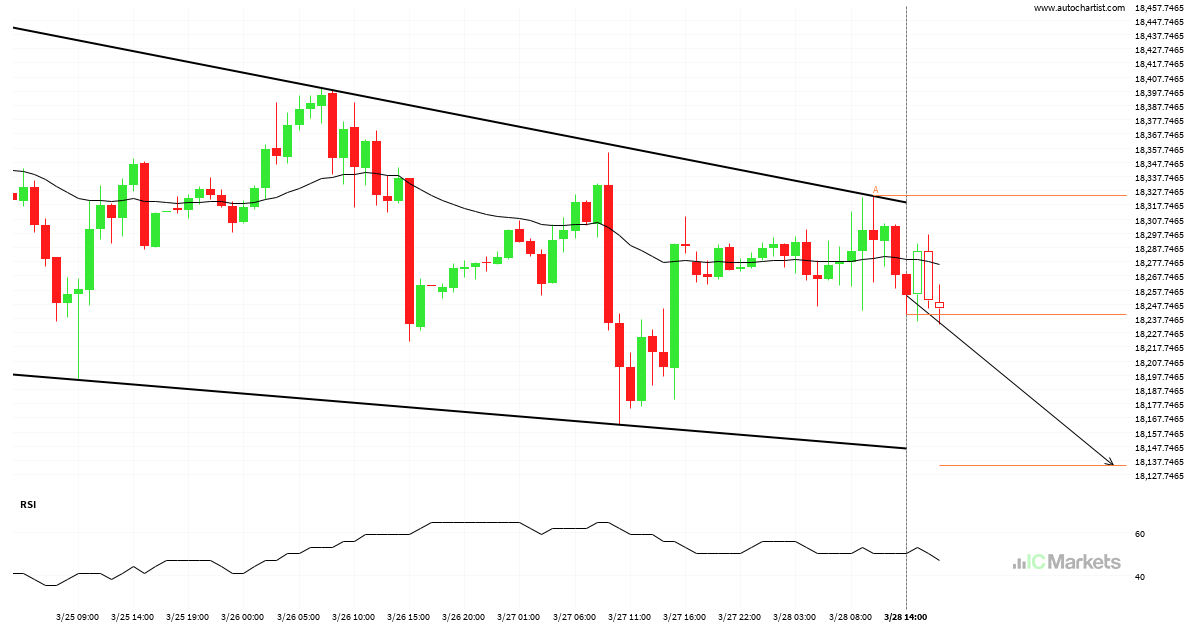
¿Tendrá el US Tech 100 Index suficiente impulso como para irrumpir el soporte?
El US Tech 100 Index se dirige a la línea de soporte de un Cuña descendente. Si este movimiento se mantiene, el precio de US Tech 100 Index podría probar el nivel de 18185.7862 en las próximas 10 horas. Ya ha probado esta línea en numerosas ocasiones, por lo que este movimiento podría durar poco […]
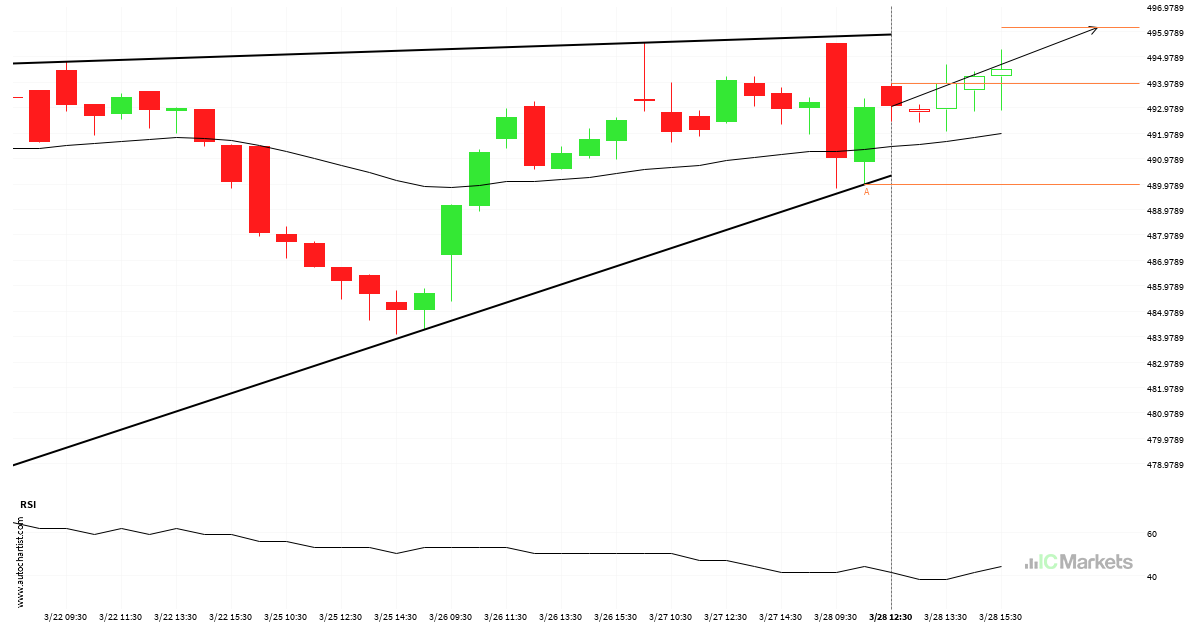
Unitedhealth Group Inc. – Patrón de gráfico Continuation – Cuña ascendente
Se detectó un patrón de Cuña ascendente emergente en Unitedhealth Group Inc. en el gráfico de 1 Hora. Hay un posible movimiento hacia 496.1193 en las próximas velas. Una vez que alcance el nivel de soporte, puede continuar su movimiento alcista o retroceder a los niveles de precios actuales.
¿Tendrá el US Tech 100 Index suficiente impulso como para irrumpir el soporte?
El US Tech 100 Index avanza hacia la línea de soporte de un Cuña descendente, que ya ha probado varias veces en el pasado. Hemos visto un retroceso antes desde esta línea, así que en esta etapa no está claro si atravesará esta línea o se recuperará como lo ha hecho anteriormente. Si el US […]